07. Text: Connecting to Data Recap
The Text Below Outlines the Previous Video
Connecting to data
Time to get started using Tableau. The first step is to load some data.
I’ve provided a data set you'll use for the rest of this lesson. The data set consists of transaction records for the Global Superstore, as well as returns, and a list of the members of the sales team. You can find the Excel file in the Resources, go ahead and download it.
If you haven't yet, start up Tableau. You should see something like this (if you have version 10):
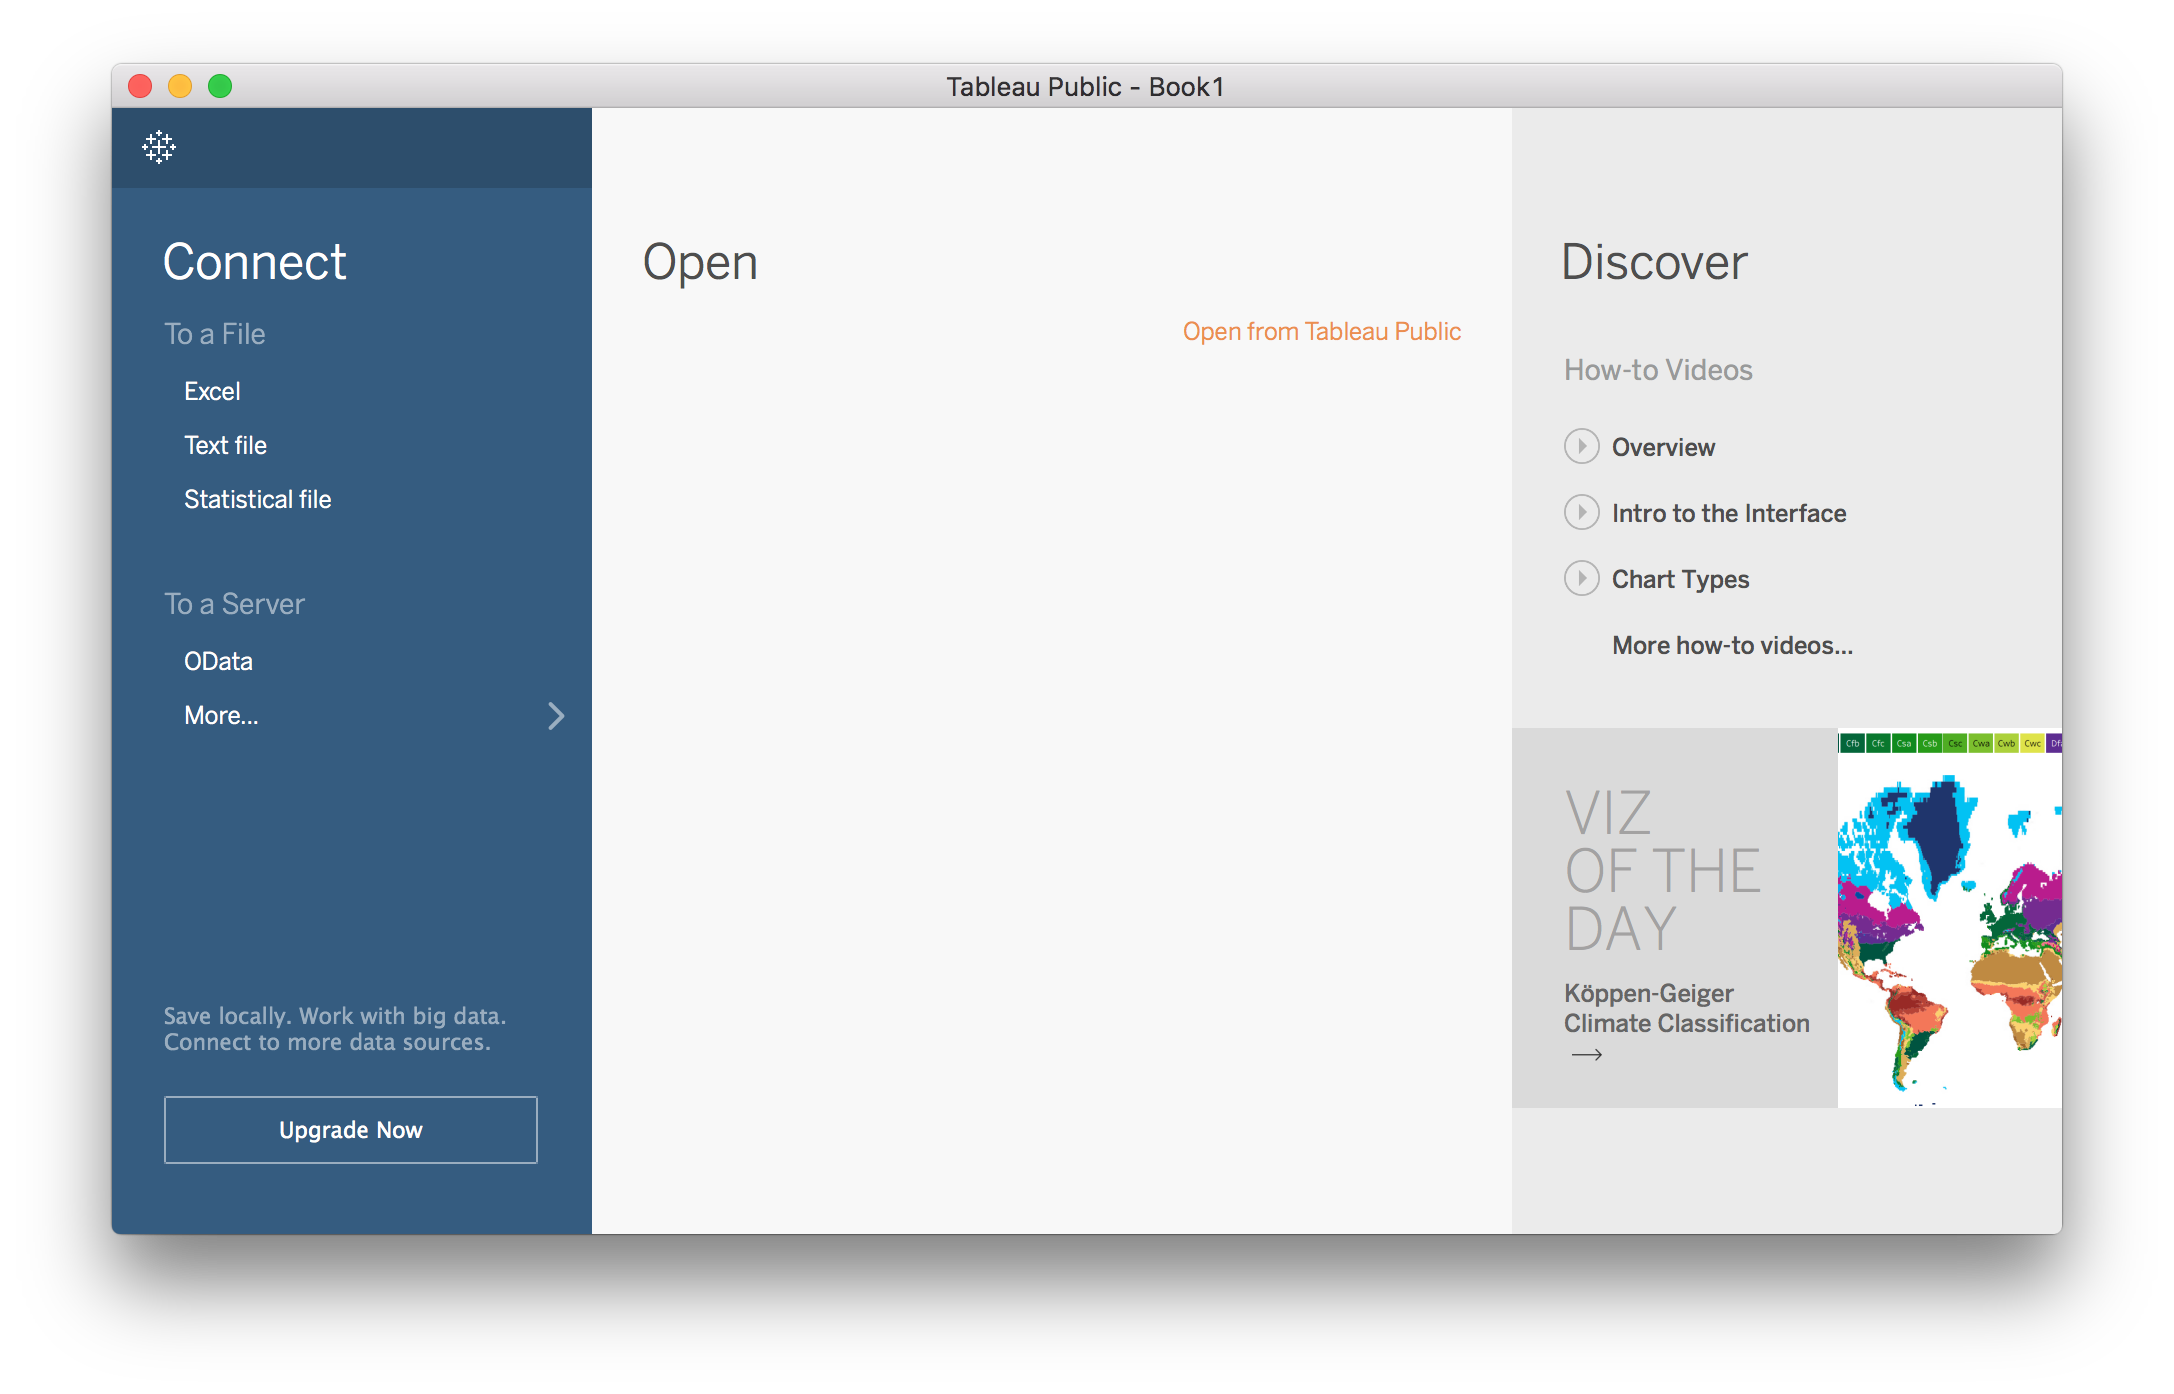
In the left sidebar you'll see the data sources you can connect to. For file sources, you can connect to an Excel file, a text file such as a CSV, or statistical files such as from SAS, SPSS, and R.
You can also connect to some remote sources (To a Server) with OData. You can also connect to Google Sheets (click through More…).
Time to load the Global Superstore data. Click on "Excel", then select the Global Superstore Excel file.
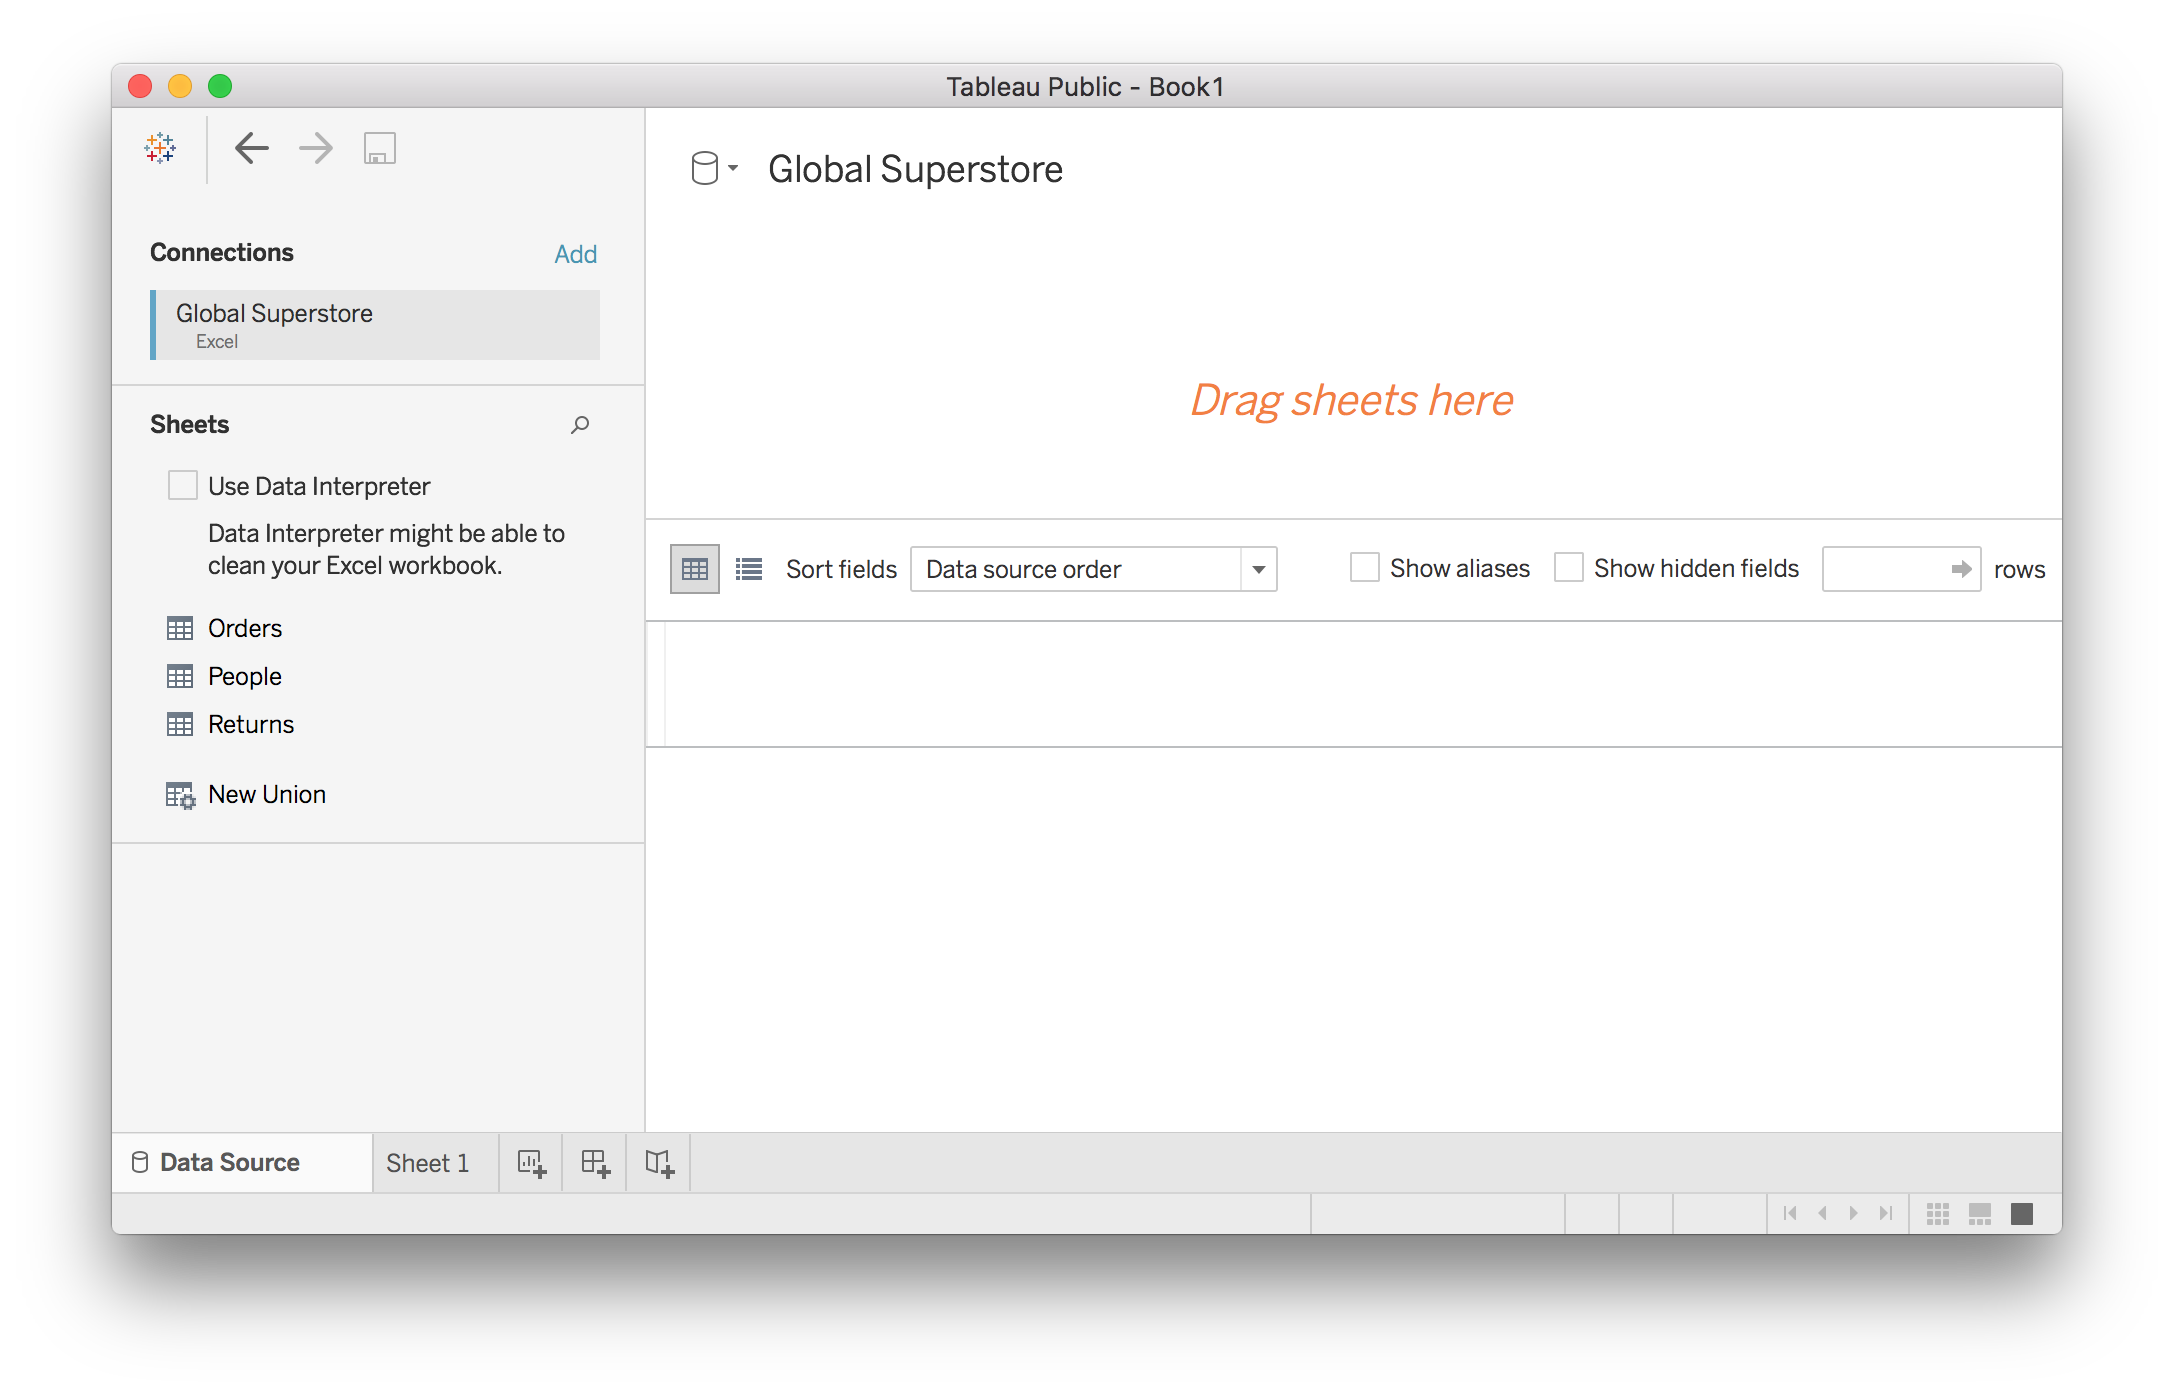
With Tableau connected to the data, you should see the sheets in the Excel file (Orders, People, and Returns) in the left sidebar. There's big orange letters tell you to drag a sheet over there, so drag the Orders sheet onto the top panel.
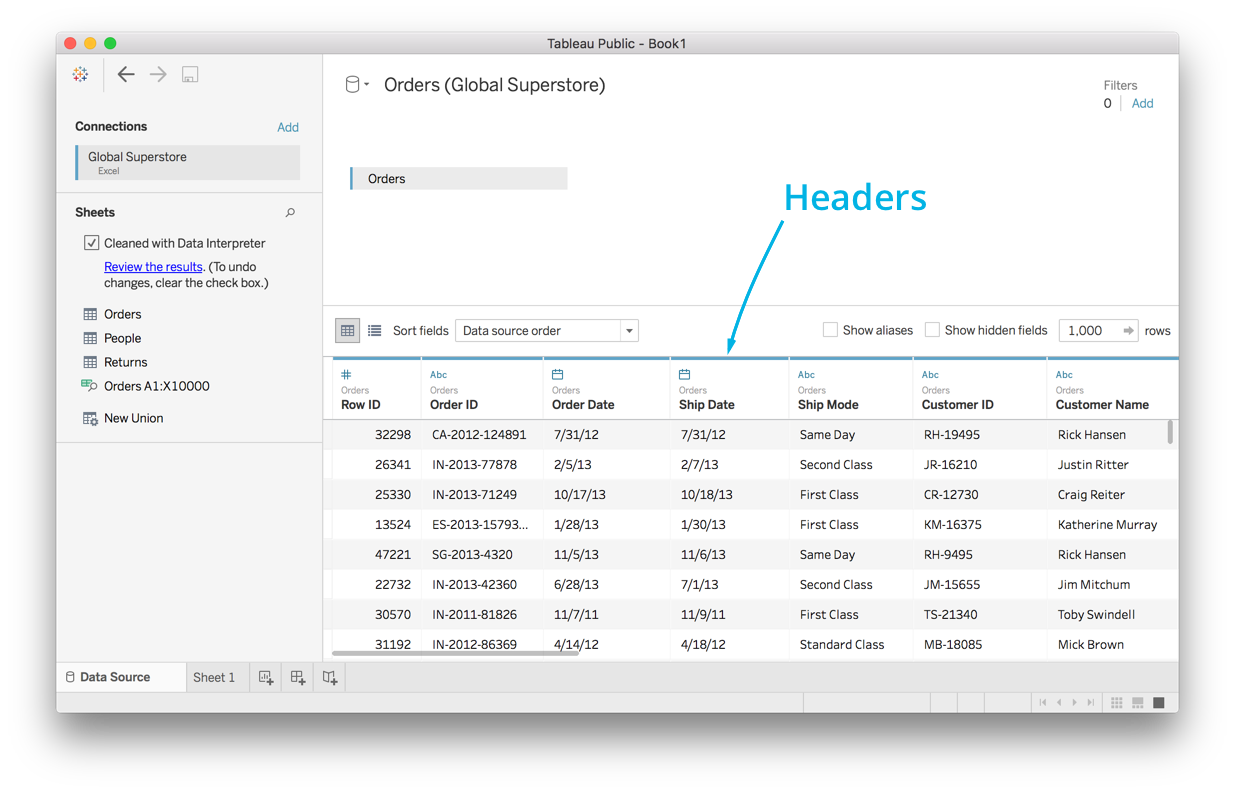
You should see a preview of the data from the orders in the lower panel now. I also used the Data Interpreter here (it's the checkbox on the left). The Data Interpreter attempts to clean and format the data so that it's easier to use in Tableau.
Tableau automatically finds the columns labels in the header row. It also attempts to detect the data type for each column. The little icons in the header bar indicate the data type of the column. Row ID is numerical data, Order ID is text, Order Date is a date, and so on.

Tableau also finds geo spatial data as you can see below.
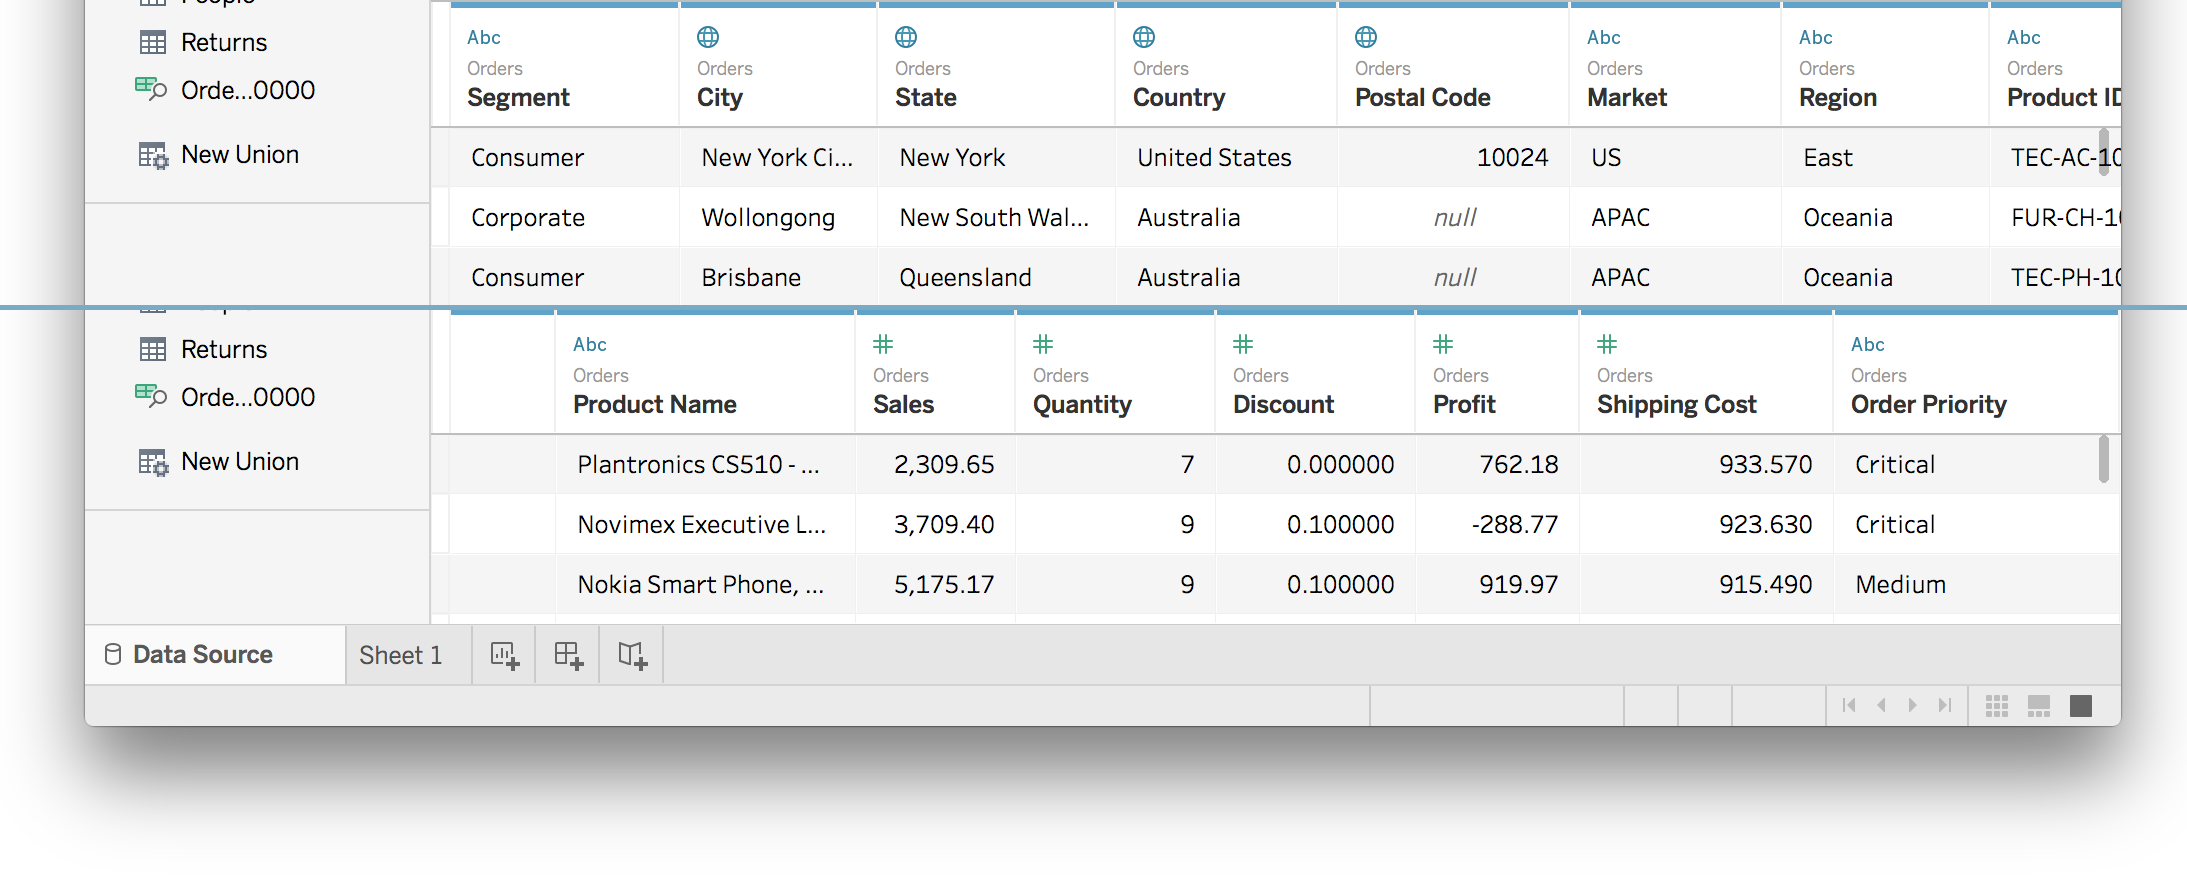
You might have noticed that the numerical icons (#) in the headers are blue in the first image but green in the one above. Tableau guesses if numerical data is discrete or continuous and indicates this with color, blue for discrete and green for continuous. You'll see this color coding again later.
Tableau doesn't always make the best guess for the data type, so you can set it manually by clicking on the data type symbol.
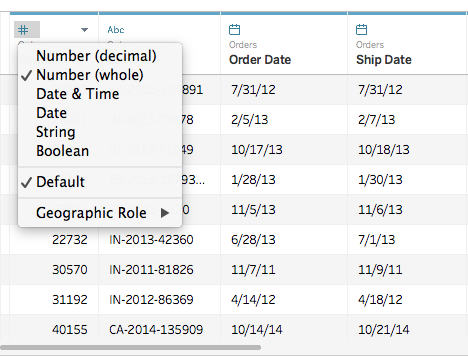
For instance, you might want to change the Row ID to a string (text) because you aren't going to be doing any math with it, it's just an identifier. Go ahead and check it out yourself.
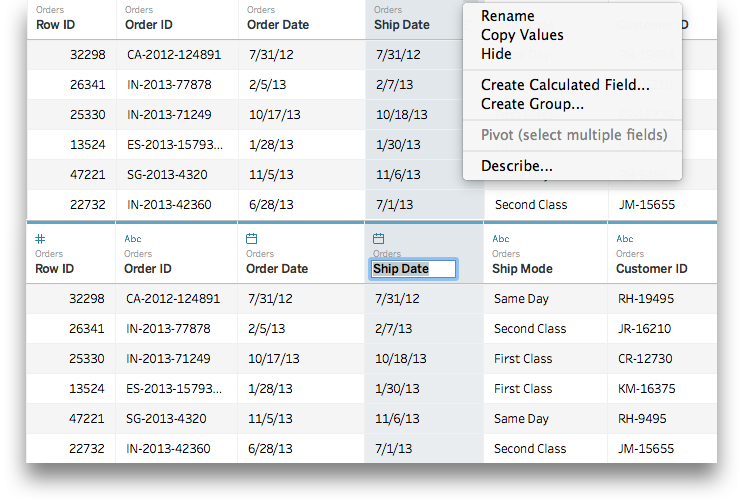
Since Tableau gets the columns names from what it guesses is the header row, some times the column names are wonky. Thankfully, you can rename them. You can either click on the triangle which drops down a menu, or just double click on the column name.
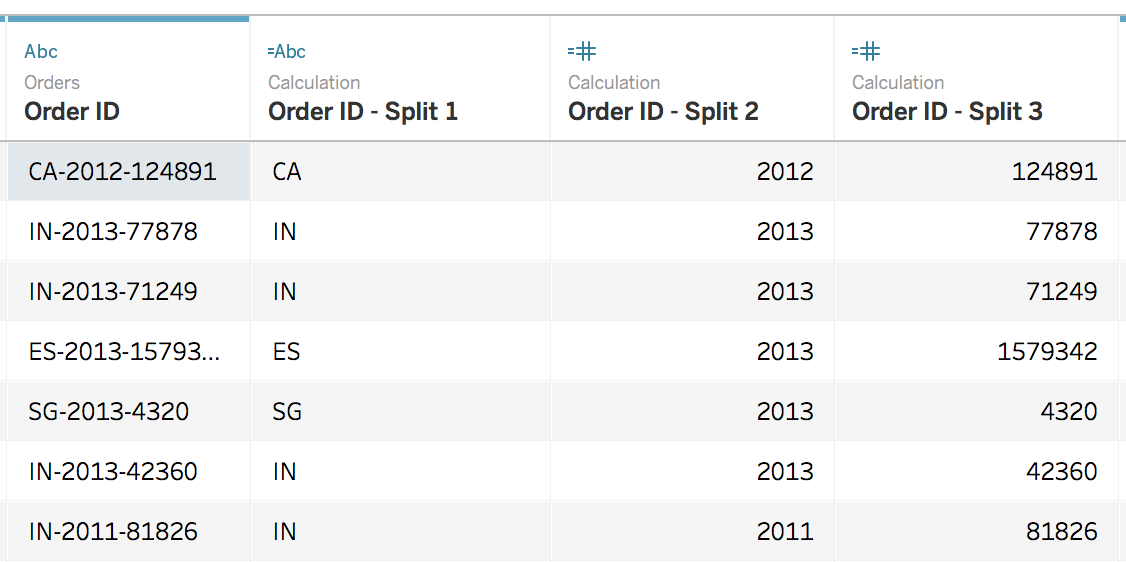
With string columns, you can do some simple transformations such as splitting the data into multiple columns. For instance, the Order IDs have three parts separated by dashes. You might want individual columns for each of these parts. To split the column, click on the little triangle in the column header.
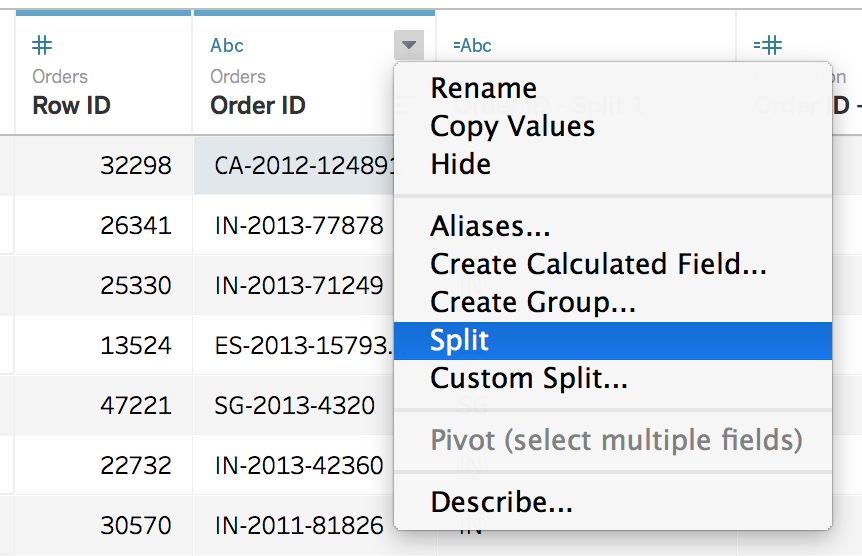
This does an automatic split where Tableau guesses the character separating the parts, a dash here. You can also do a custom split (select Custom Split… instead) to choose a different character to split on. After the split, there will be new columns for each part. Here's what it looks like, try it yourself.
In the drop down menu, you'll also see Create Calculated Field…. This lets you create new columns from existing columns. You can check it out in Tableau or read more about it in the documentation, but I'll cover calculated fields in detail later.
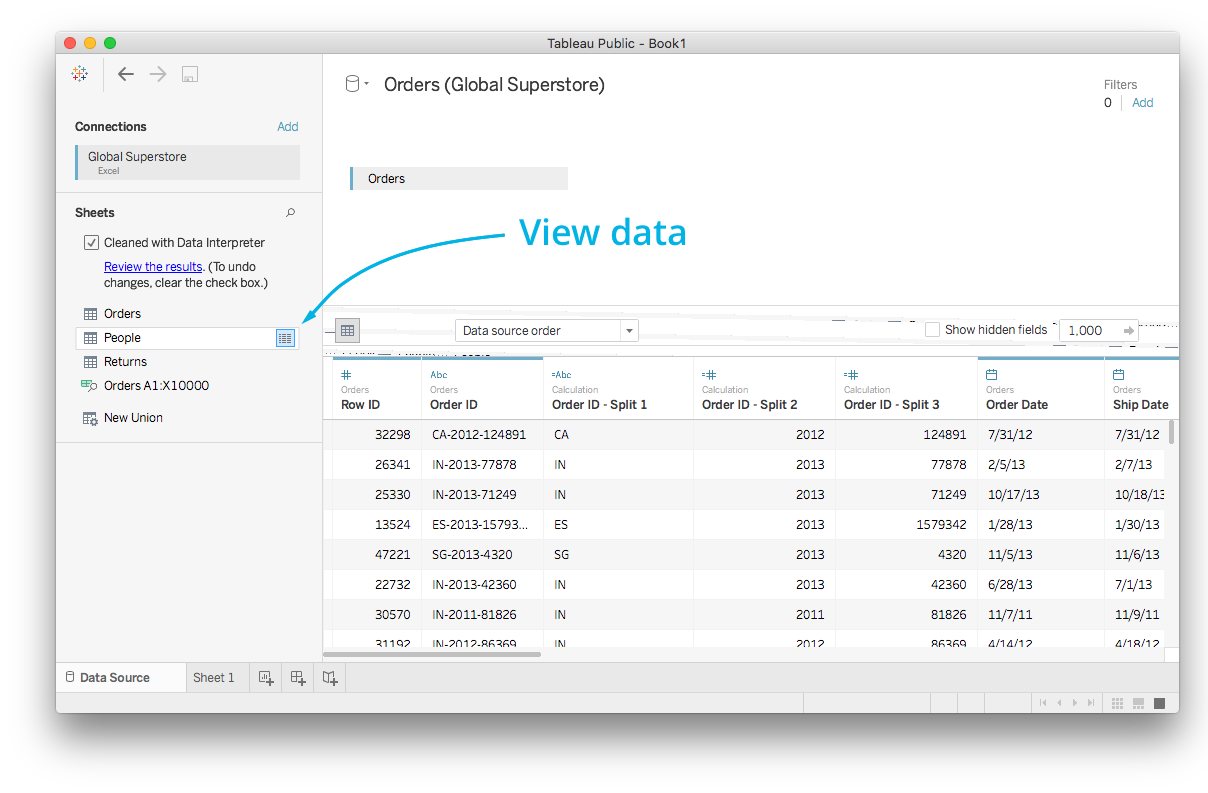
View data
Something I find useful often is being able to quickly preview the data in a table. If you hover over one of the sheets, an icon appears to the right. Clicking on this lets you view the data.
